All your organization's transaction data, within reach.
The Reporting section allows organizations to measure performance based on any metric tracked by iDonate. For instance, you could determine which ZIP code has the most recurring donations, which state is the most active, or which giving channel has the highest usage, to name a few of the many combinations of data able to be tracked by iDonate Reporting.
Selecting a Report
| By using the drop-down in the top-left of the interface, you can select one of iDonate's pre-made reports (also known as a "canned" report), or one that you have created yourself. | 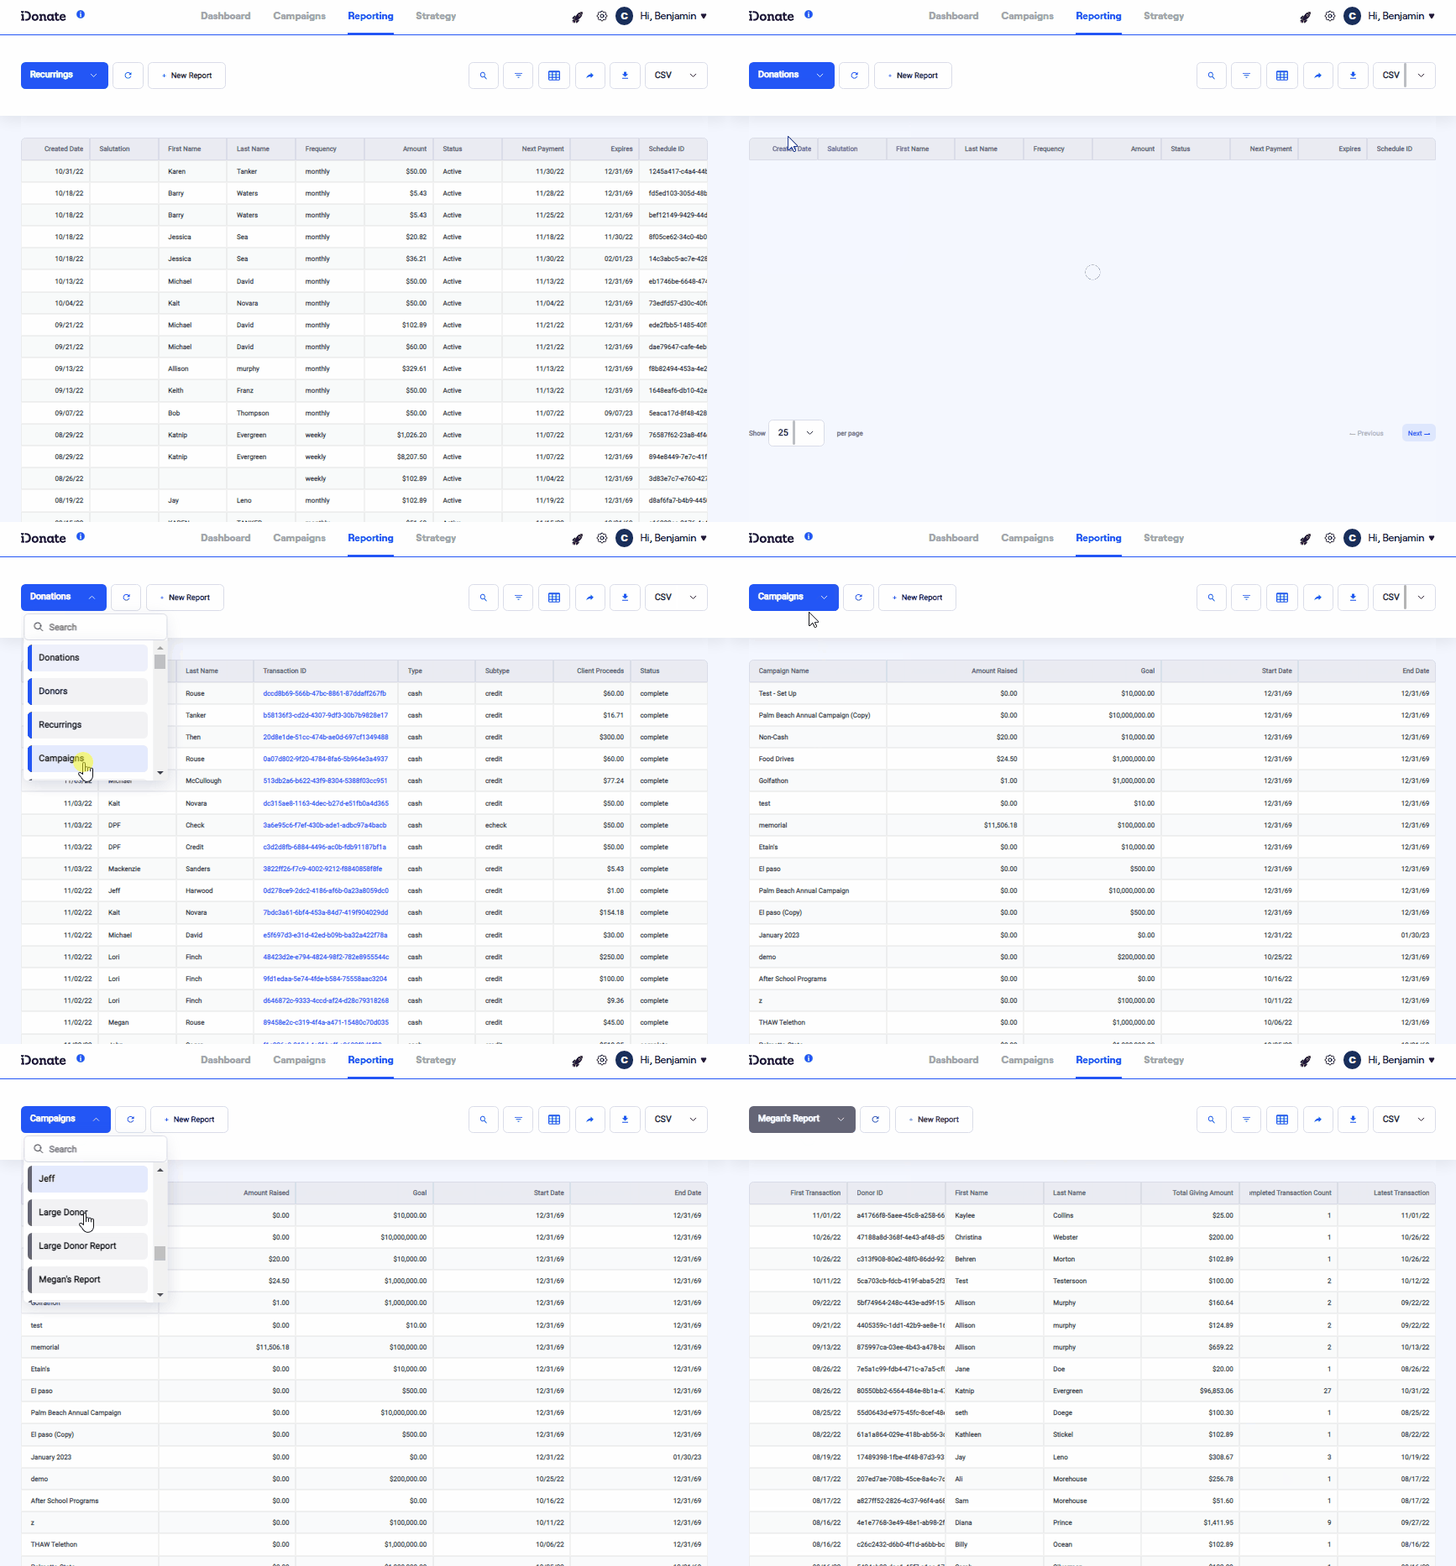 |
Creating a New Report
|
|
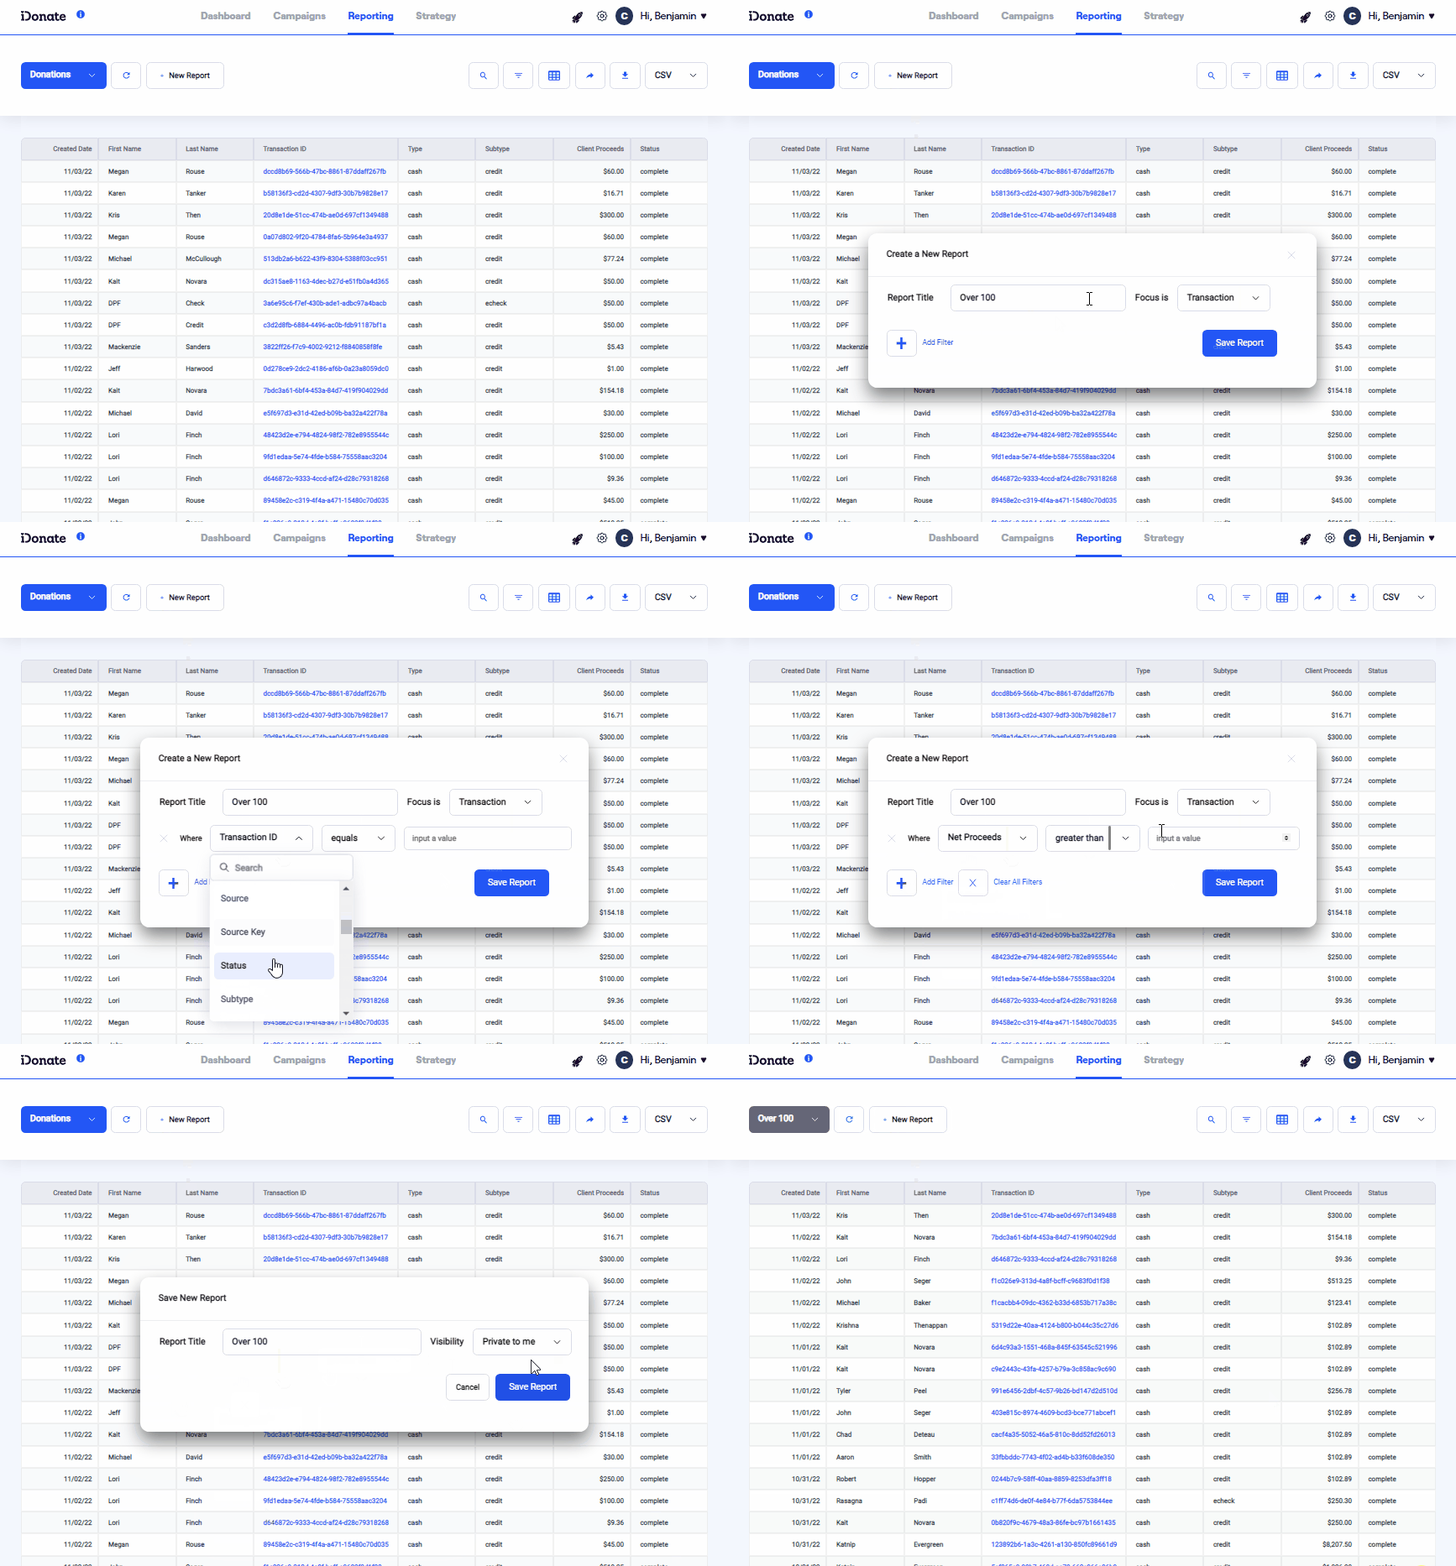
To create a new report, select New Report. After naming the report, select the focus of either Donor, Transaction, or Schedule. |
Using the Search Bar
| The Search Bar can find specific data within the Report table. For instance, if you wanted to find a donor with the last name of "Rockefeller", enter "Rockefeller" into the search bar of a report that includes Last Name as a column. | 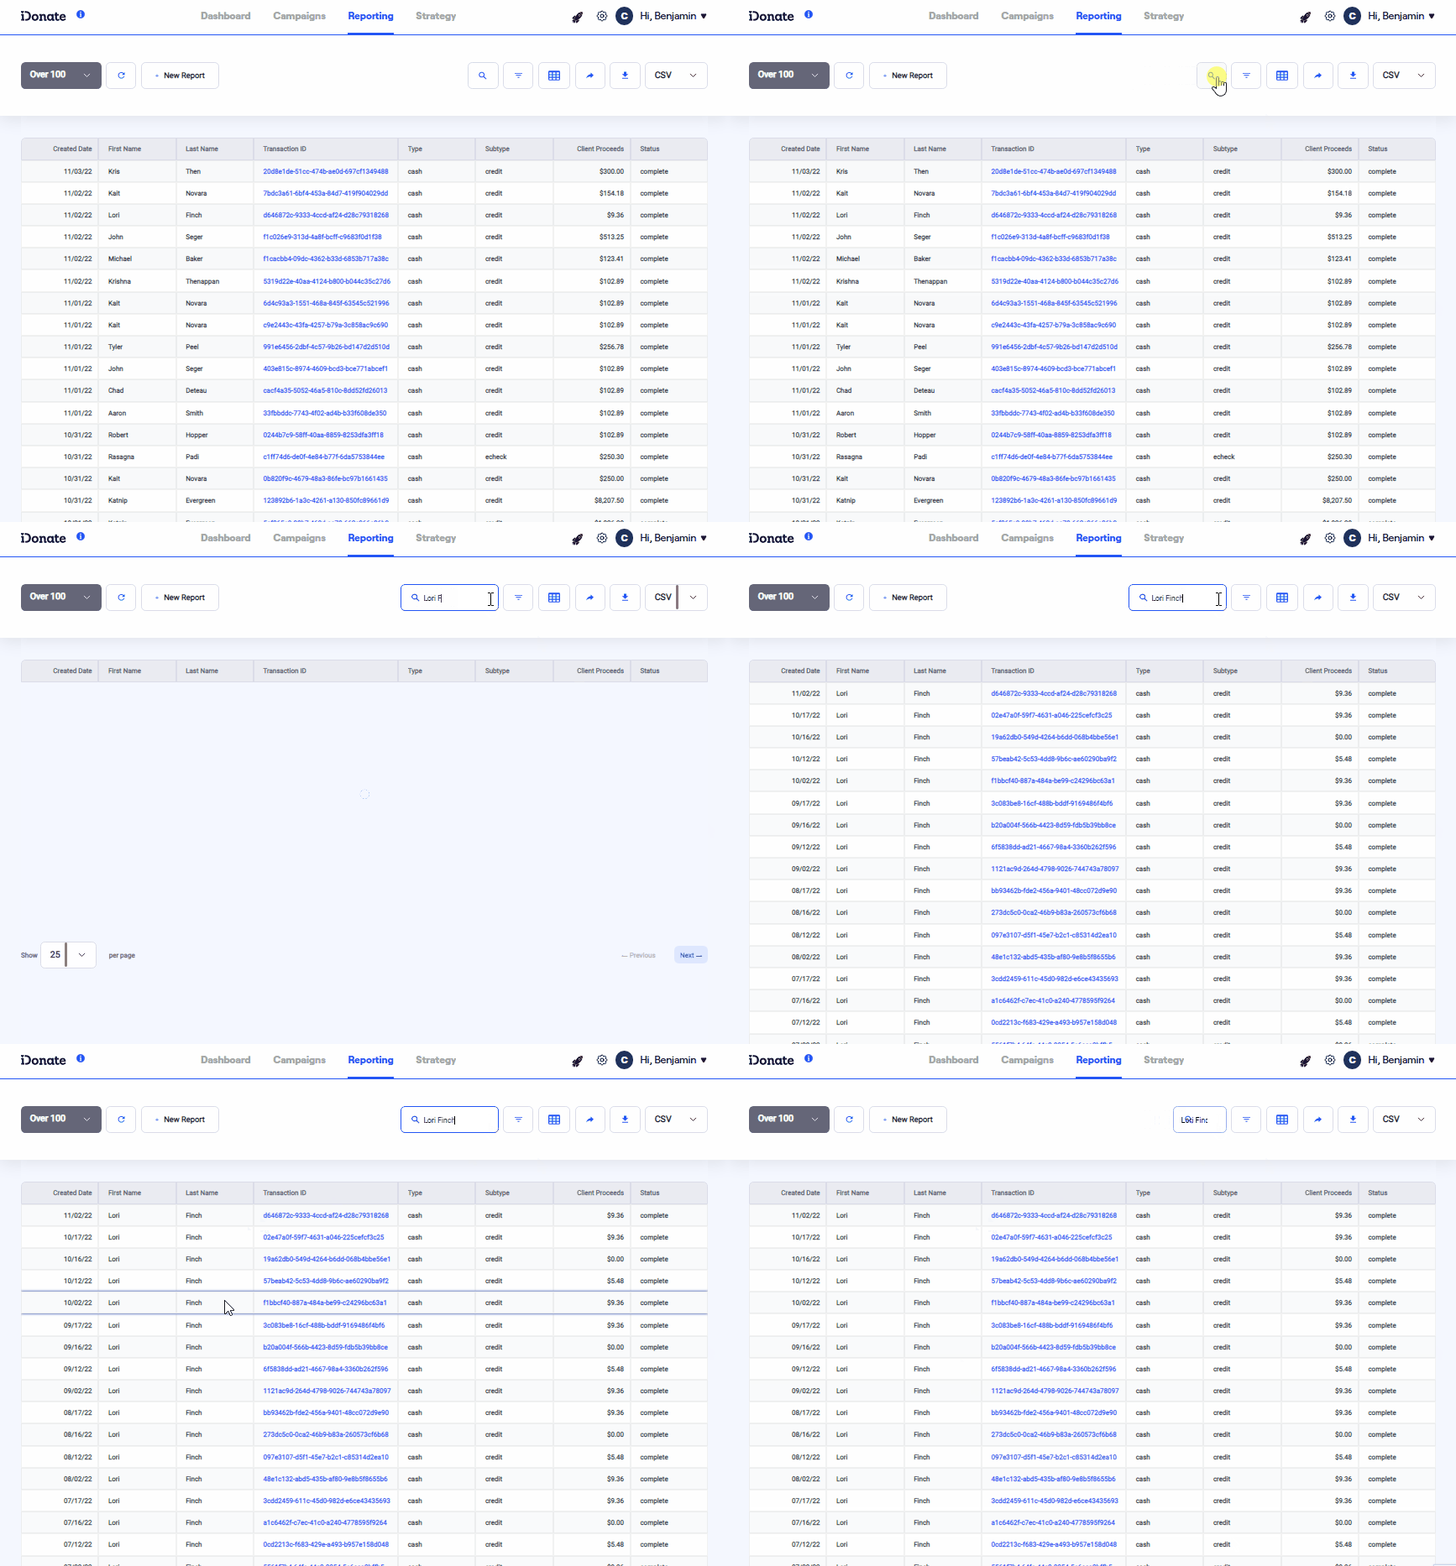 |
Using the Quick Filter
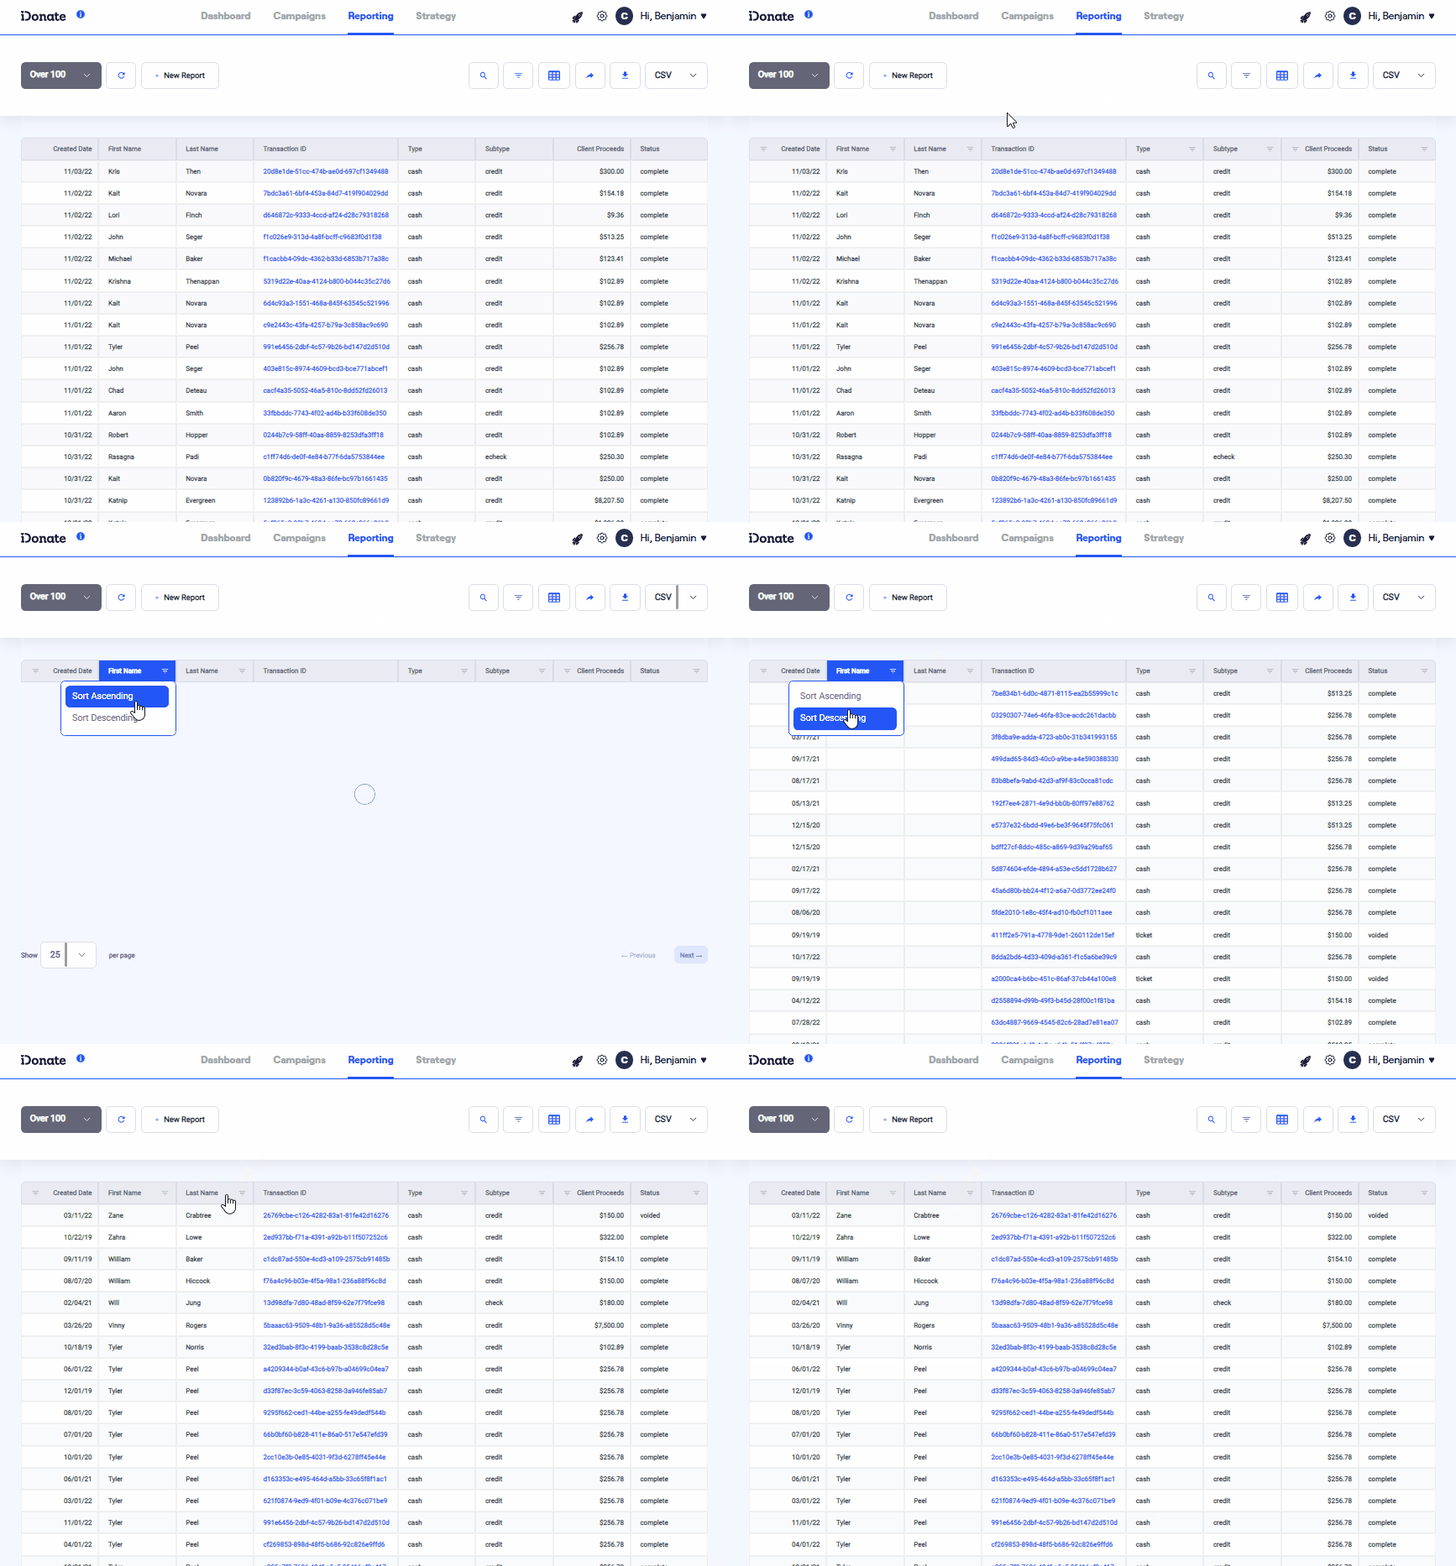 |
A quick and easy way to ascertain maximums and minimums is to use the Quick Filter button, which gives you the ability to sort the table based on a certain column's value, sorted sequentially. For instance, to find the highest Client Proceeds, enable Quick Filters, then sort the Client Proceeds column from high to low. |
Customize Report
|
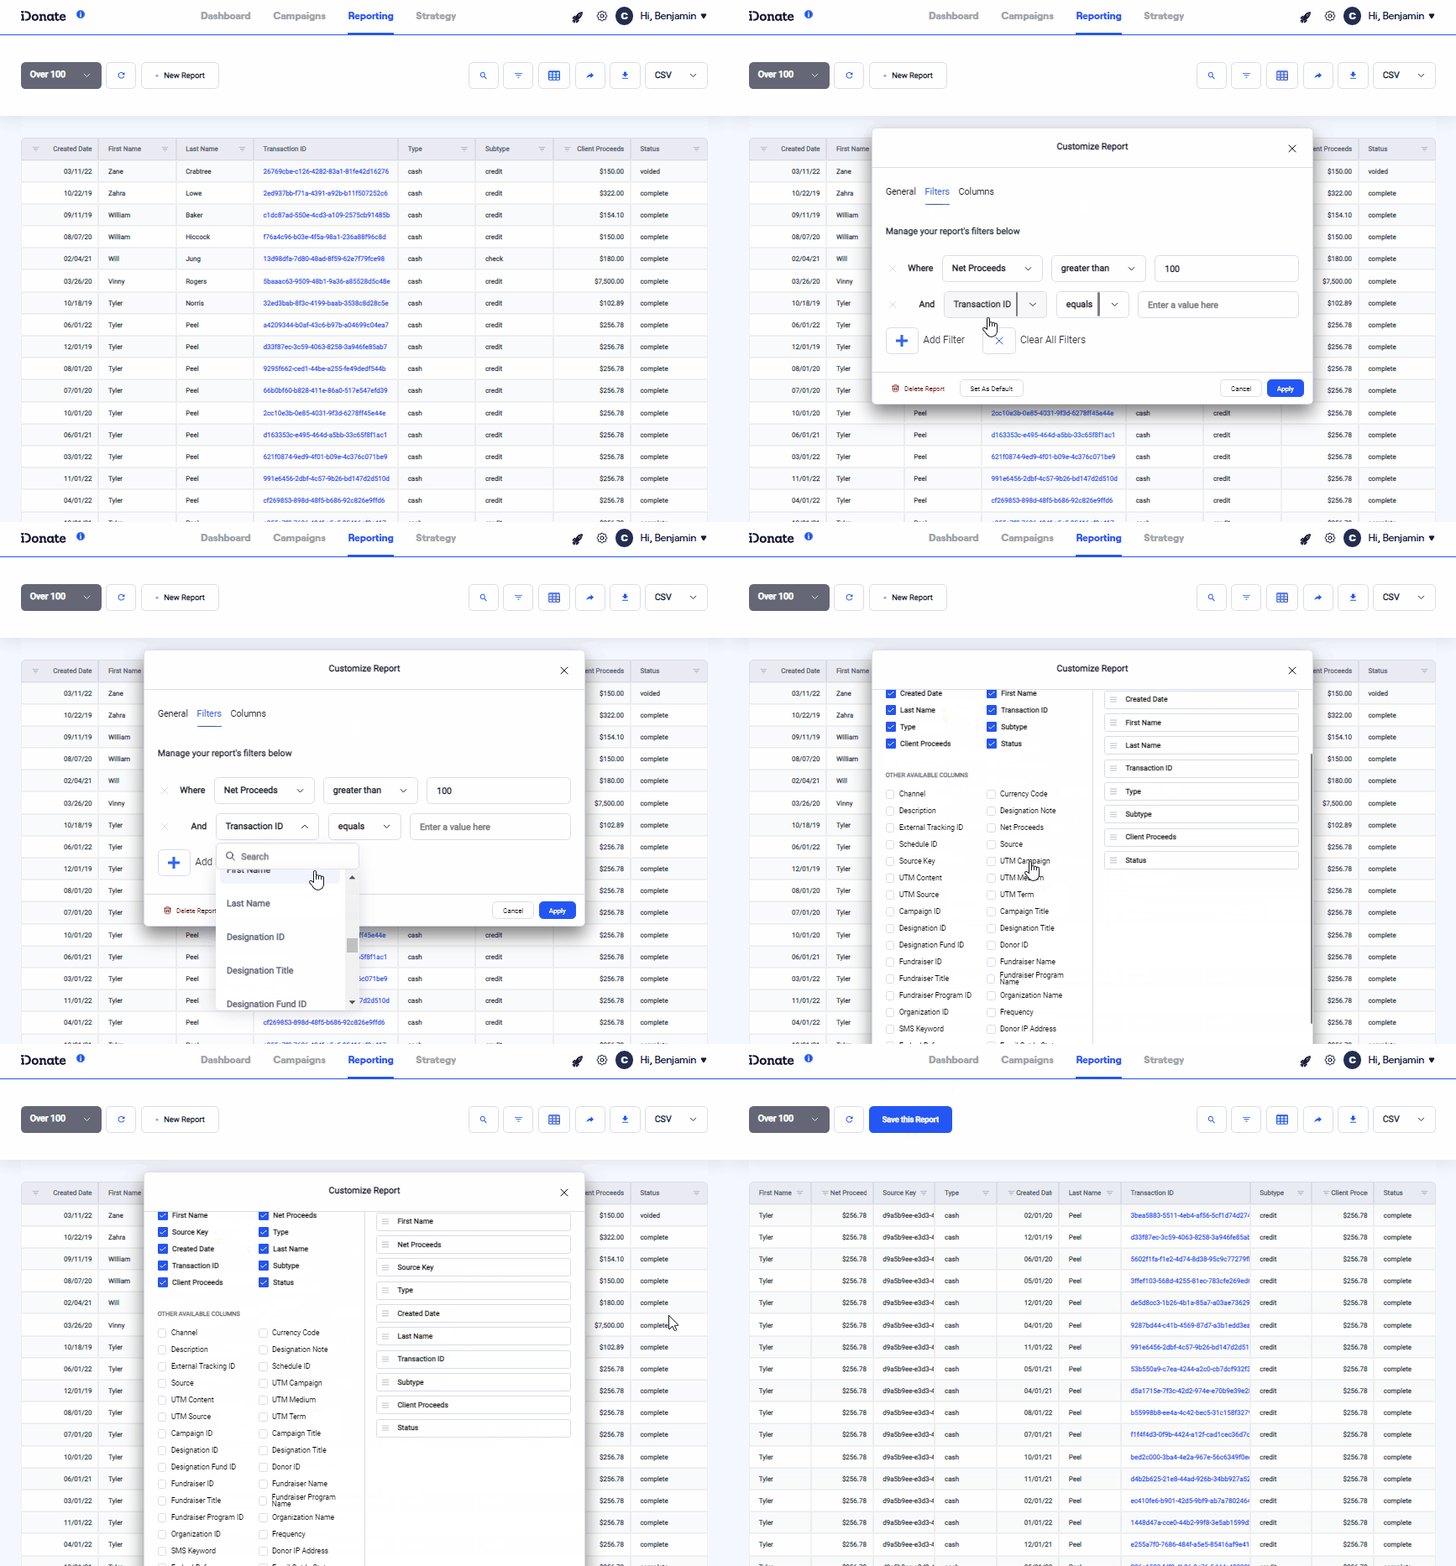
Select the Customize Report icon to bring up additional filtering options for your report.
To save your changes, select Apply. To set the report as the default view when you open Reporting, select Set as Default. To delete the report, select Delete Report`. |
 |
Exporting a Report
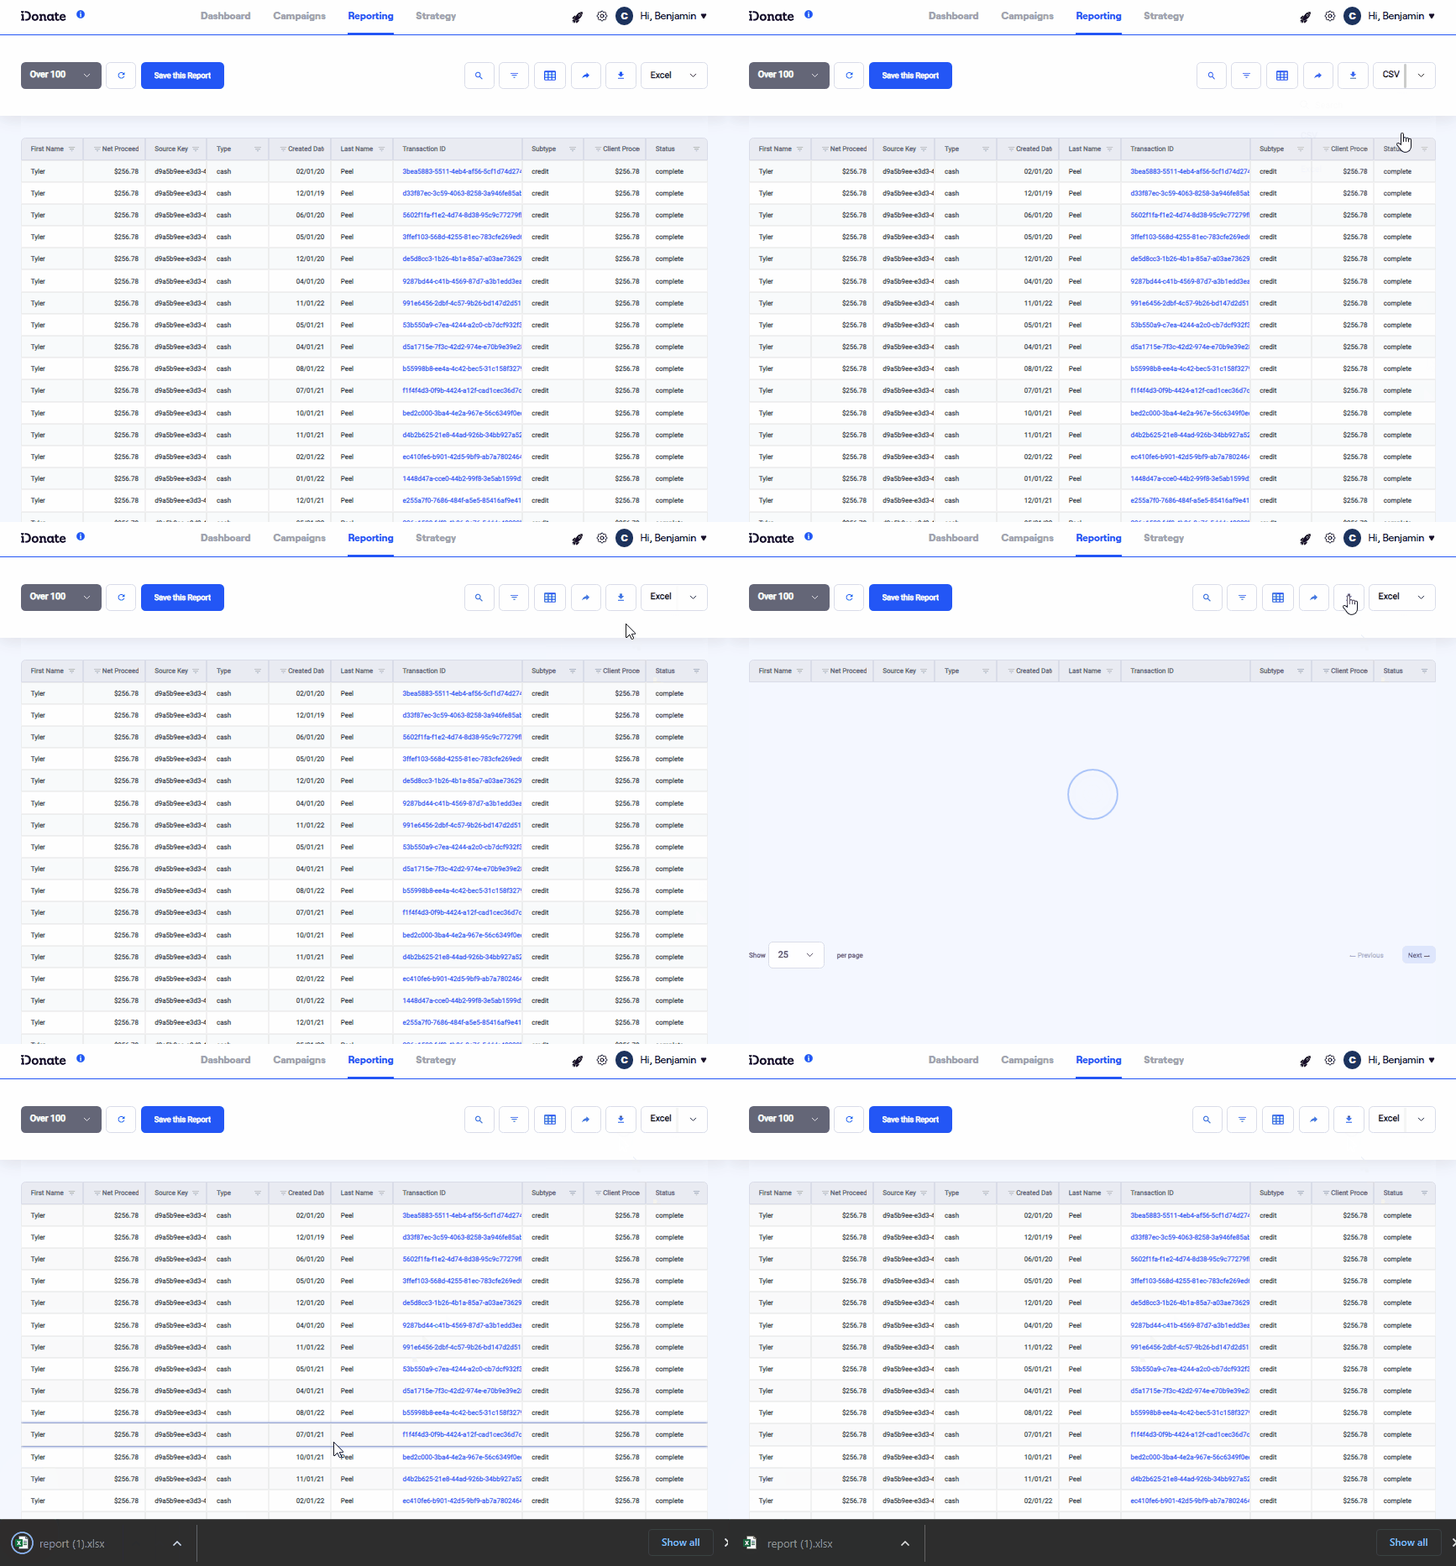 |
To dive even further into the data, you can use your spreadsheet software of choice to visualize your report. To export your report as either an XLS or CSV file, select your file format and then the Export icon. |

